AWS published a technical walkthrough showing how to instrument LLM inference on Amazon SageMaker AI so teams can observe serving infrastructure and model output quality in a single view. The guide maps an end‑to‑end data flow that correlates per‑GPU, container and instance metrics with sampled quality signals from model outputs, enabling faster detection and investigation of problems that span both infrastructure and model behavior. This matters to builders and operations teams running production LLMs because the combined telemetry helps prioritize fixes and adjust scaling policies based on both cost and output quality.
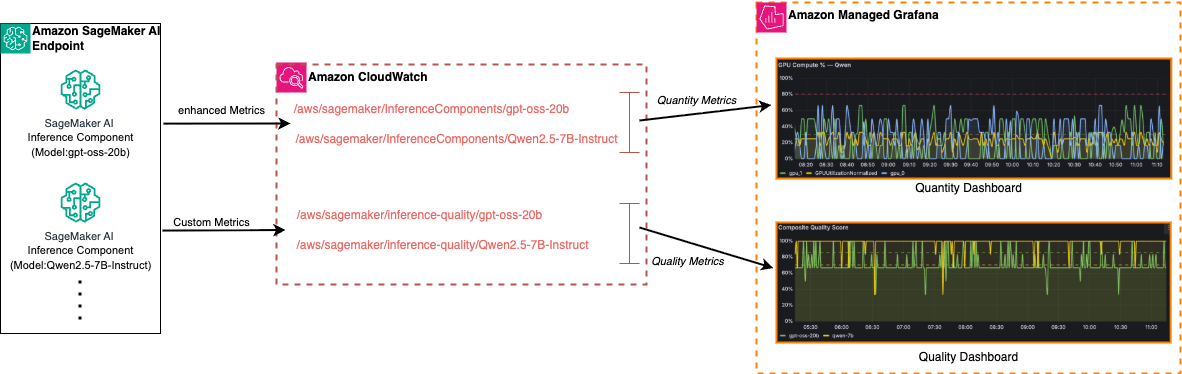
The reference architecture centers on three services: Amazon SageMaker AI endpoints running inference components, Amazon CloudWatch as the centralized metrics store, and Amazon Managed Grafana as the visualization and alerting layer. A single SageMaker AI endpoint can host multiple inference components (the walkthrough shows examples such as gpt-oss-20b and Qwen2.5 — 7B‑Instruct), which lets teams isolate traffic routing, onboarding, and scaling policies per model while sharing the same underlying instances.
On the instrumentation side, SageMaker AI can publish enhanced metrics automatically when enabled in an endpoint configuration. Those enhanced metrics include instance‑level, container‑level and per‑GPU dimensions and are logged under the /aws/sagemaker/InferenceComponents/ namespace in CloudWatch. In parallel, the walkthrough recommends pushing custom quality metrics — produced by sampling LLM outputs and computing composite scores for accuracy, safety/compliance and consistency — into CloudWatch so the two metric streams can be correlated.
The post frames observability across two complementary dimensions: quantity and quality. Quantity covers throughput, latency, error rates and GPU/CPU utilization; quality covers response accuracy, safety signals and model drift. It emphasizes typical operational challenges for generative workloads — unpredictable token consumption, GPU memory pressure and latency spikes — and explains how focusing on only one dimension (for example, infrastructure metrics without quality signals) can mask production problems and lead to poor capacity planning or avoidable cost overruns.
Practically, ingesting both infrastructure and quality metrics into Managed Grafana enables hybrid thresholds and automated alerts that join indicators from both domains, comparative analysis across models and configurations, and iterative trade‑offs between cost and output. The described architecture and exported telemetry give teams concrete signals to investigate bottlenecks, detect model drift, and tune scaling policies for production LLM deployments on SageMaker AI.
Sources
Replies (0)
No replies in this topic yet.