Datadog has introduced Database Investigator inside Datadog Database Monitoring to help teams diagnose and remediate database performance problems more quickly. The tool acts as an interactive diagnostic assistant that synthesizes telemetry and context so engineers receive targeted explanations and actionable steps instead of raw counters they must stitch together. That matters because resolving database issues faster reduces downtime, shortens mean time to resolution (MTTR) and cuts the number of escalations for DBAs, platform teams and application developers without deep tuning expertise.
Under the hood, Database Investigator examines workload metrics, query samples, execution plans, logs and distributed traces, then runs automated checks and returns prioritized findings. Suggested remediation steps include direct links to the implicated queries, services and database instances, and the UI displays live graphs to confirm symptoms or validate fixes. Engineers can refine an investigation by adding context or asking follow‑up questions in plain language, iterating on the diagnosis without switching tools.
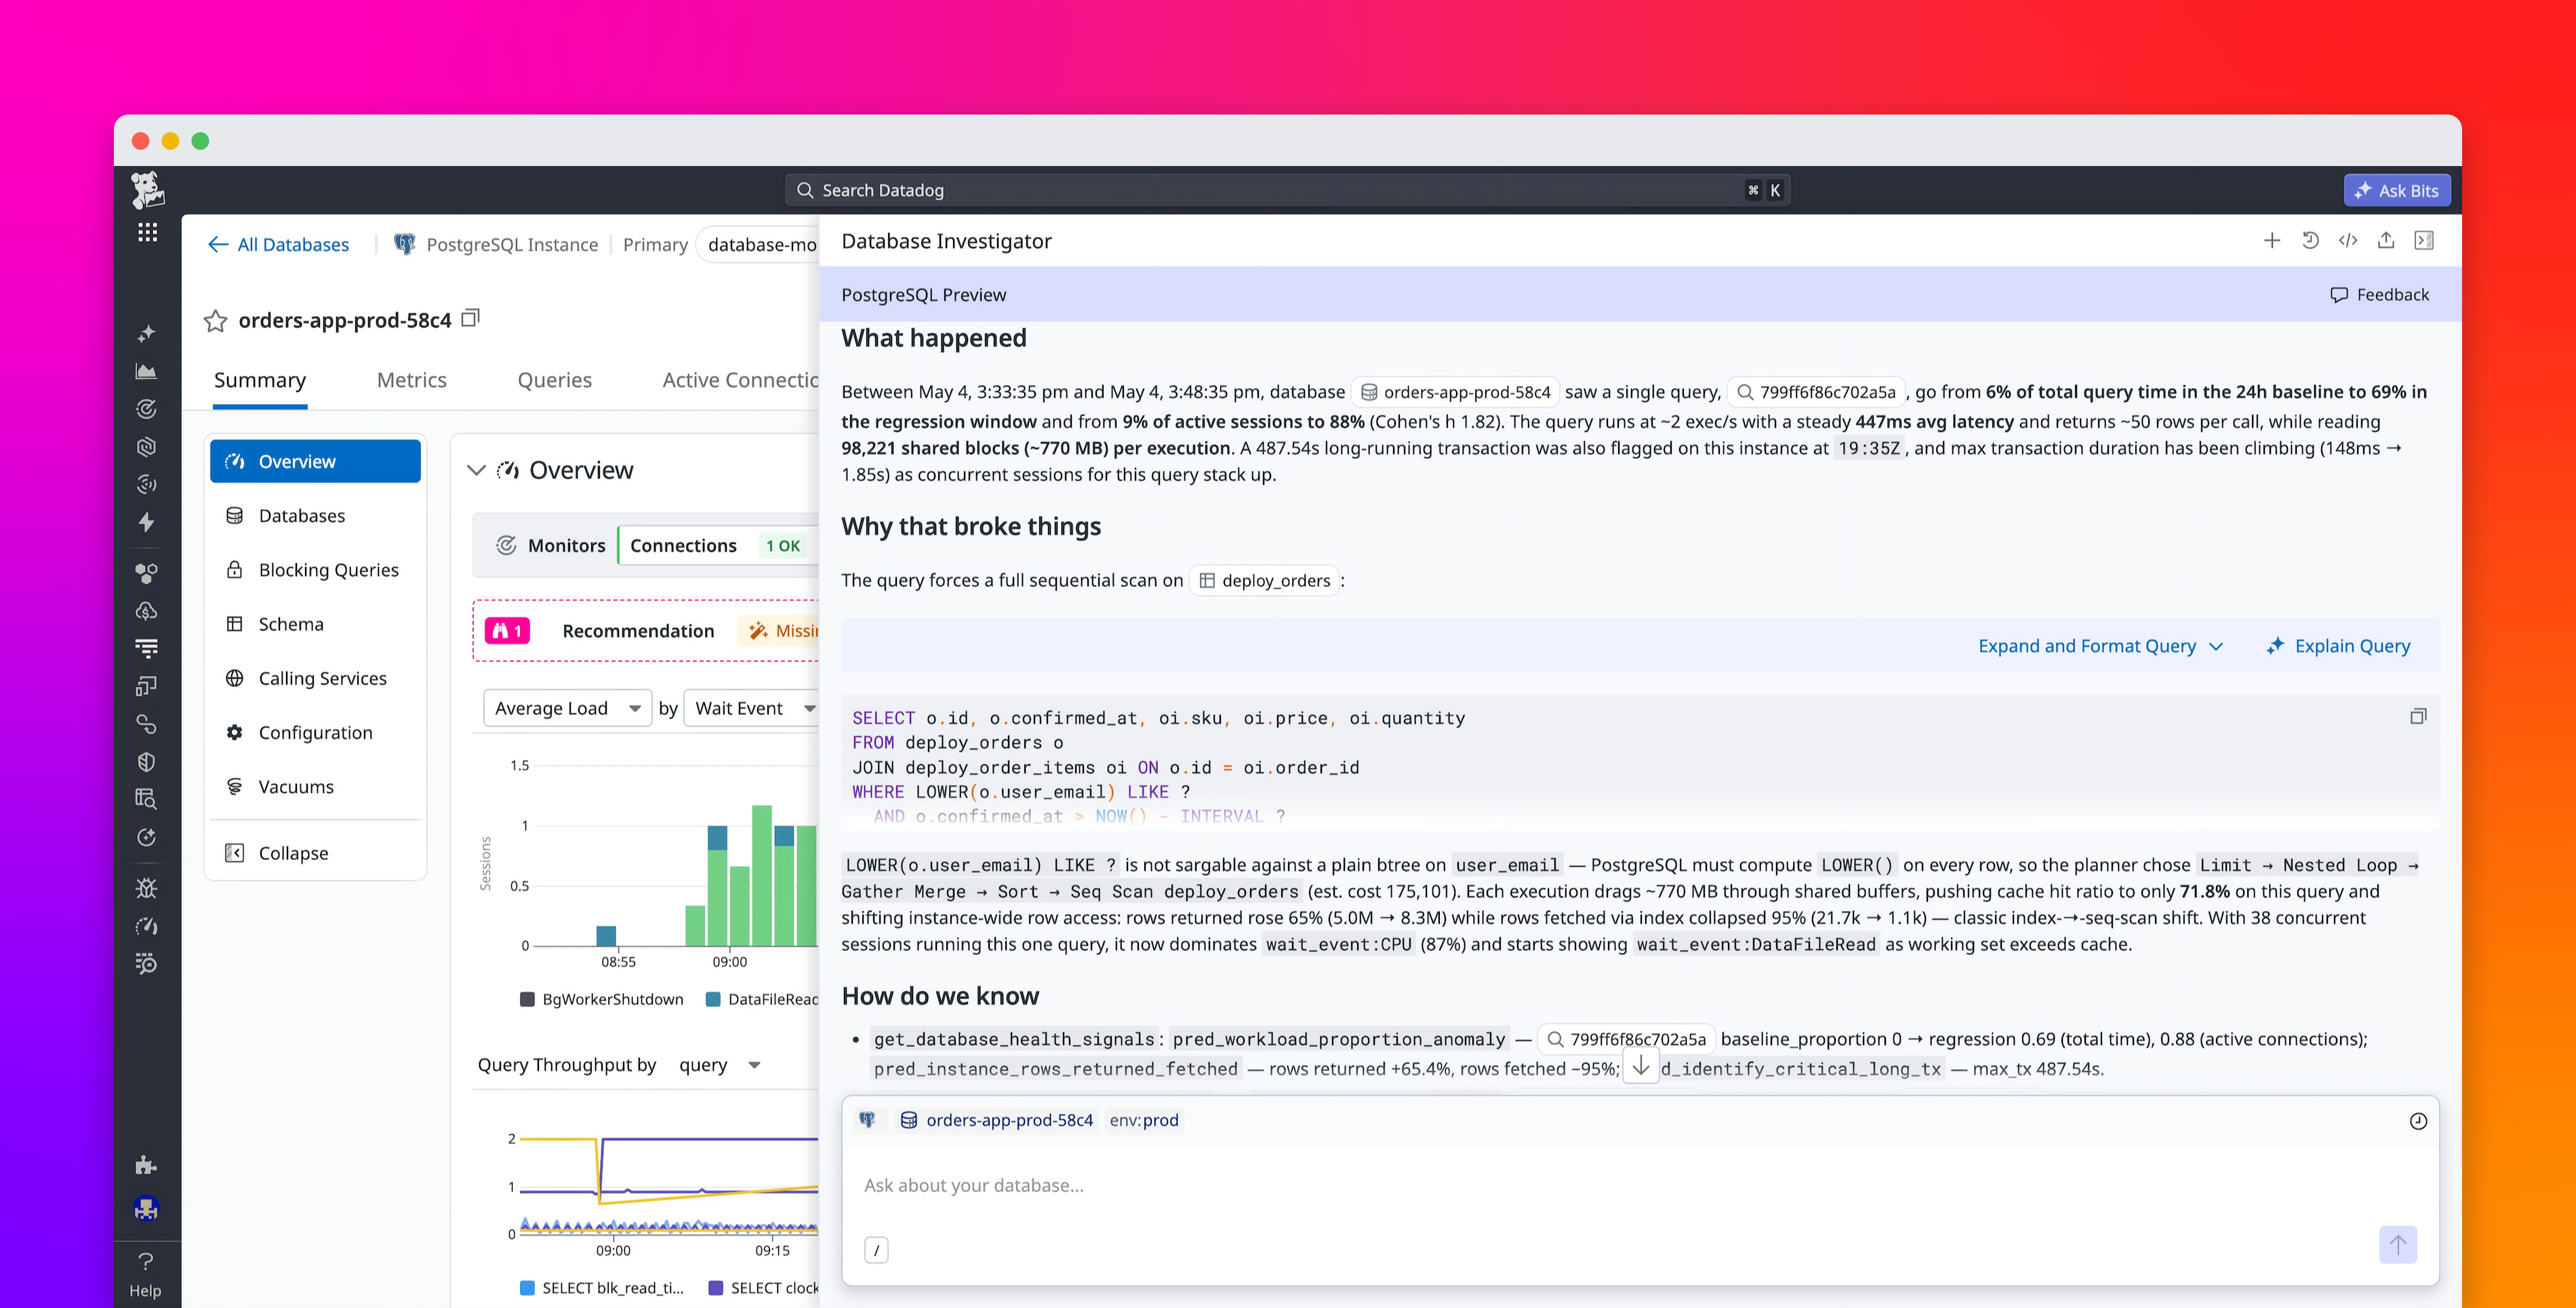
Datadog illustrates the workflow with an on‑call scenario: when an endpoint’s p95 latency jumped from 15 ms to 447 ms, Database Investigator launched more than 15 health checks immediately and surfaced that query latency had spiked and that roughly 770 MB of shared blocks were being read with each query. Those findings pointed investigators to the offending query and the specific instance to remediate, allowing teams to move directly from detection to verification of a fix using live telemetry.
The feature is explicitly designed to remove the common friction of manual correlation across separate systems. Traditional troubleshooting forces engineers to flip between APM traces, deployment logs, service dashboards and execution plans; Database Investigator consolidates distributed traces, query metrics and node‑level execution plans into a single investigative view so it can identify which query regressed and on which node. By prioritizing findings, it also helps teams focus on the most likely root causes first.
Datadog frames the capability as practical tooling for builders: DBAs, platform teams and application developers who may lack deep database tuning experience. The blog highlights use cases Database Investigator can detect and explain, including tracing latency spikes to a source, diagnosing connection pool exhaustion and catching replication lag before it affects correctness. because each recommended step links to live telemetry and artifacts, teams can both confirm symptoms and verify fixes in situ and then continue the investigation with additional queries or context.
Sources
Replies (0)
No replies in this topic yet.