Datadog Sheets links spreadsheet — style tooling directly to Cloud Cost Management (CCM) datasets so teams can run live analyses without repeatedly exporting raw cost data. Instead of creating static CSVs that quickly go stale, Sheets exposes structured, CCM-backed tables that update as new cost records arrive, letting users build reports and forecasts that remain current.
Sheets surfaces daily cloud cost broken down by provider and service into CCM-backed tables that support calculated columns and pivot — style aggregations. Separate spreadsheet — style tabs (currently listed as Preview) let users write formulas that reference those live table rows and design custom layouts for reporting or planning. The interface aims to preserve spreadsheet flexibility — users can create derived metrics, reuse formulas across tabs, and pivot the same source data for multiple views.
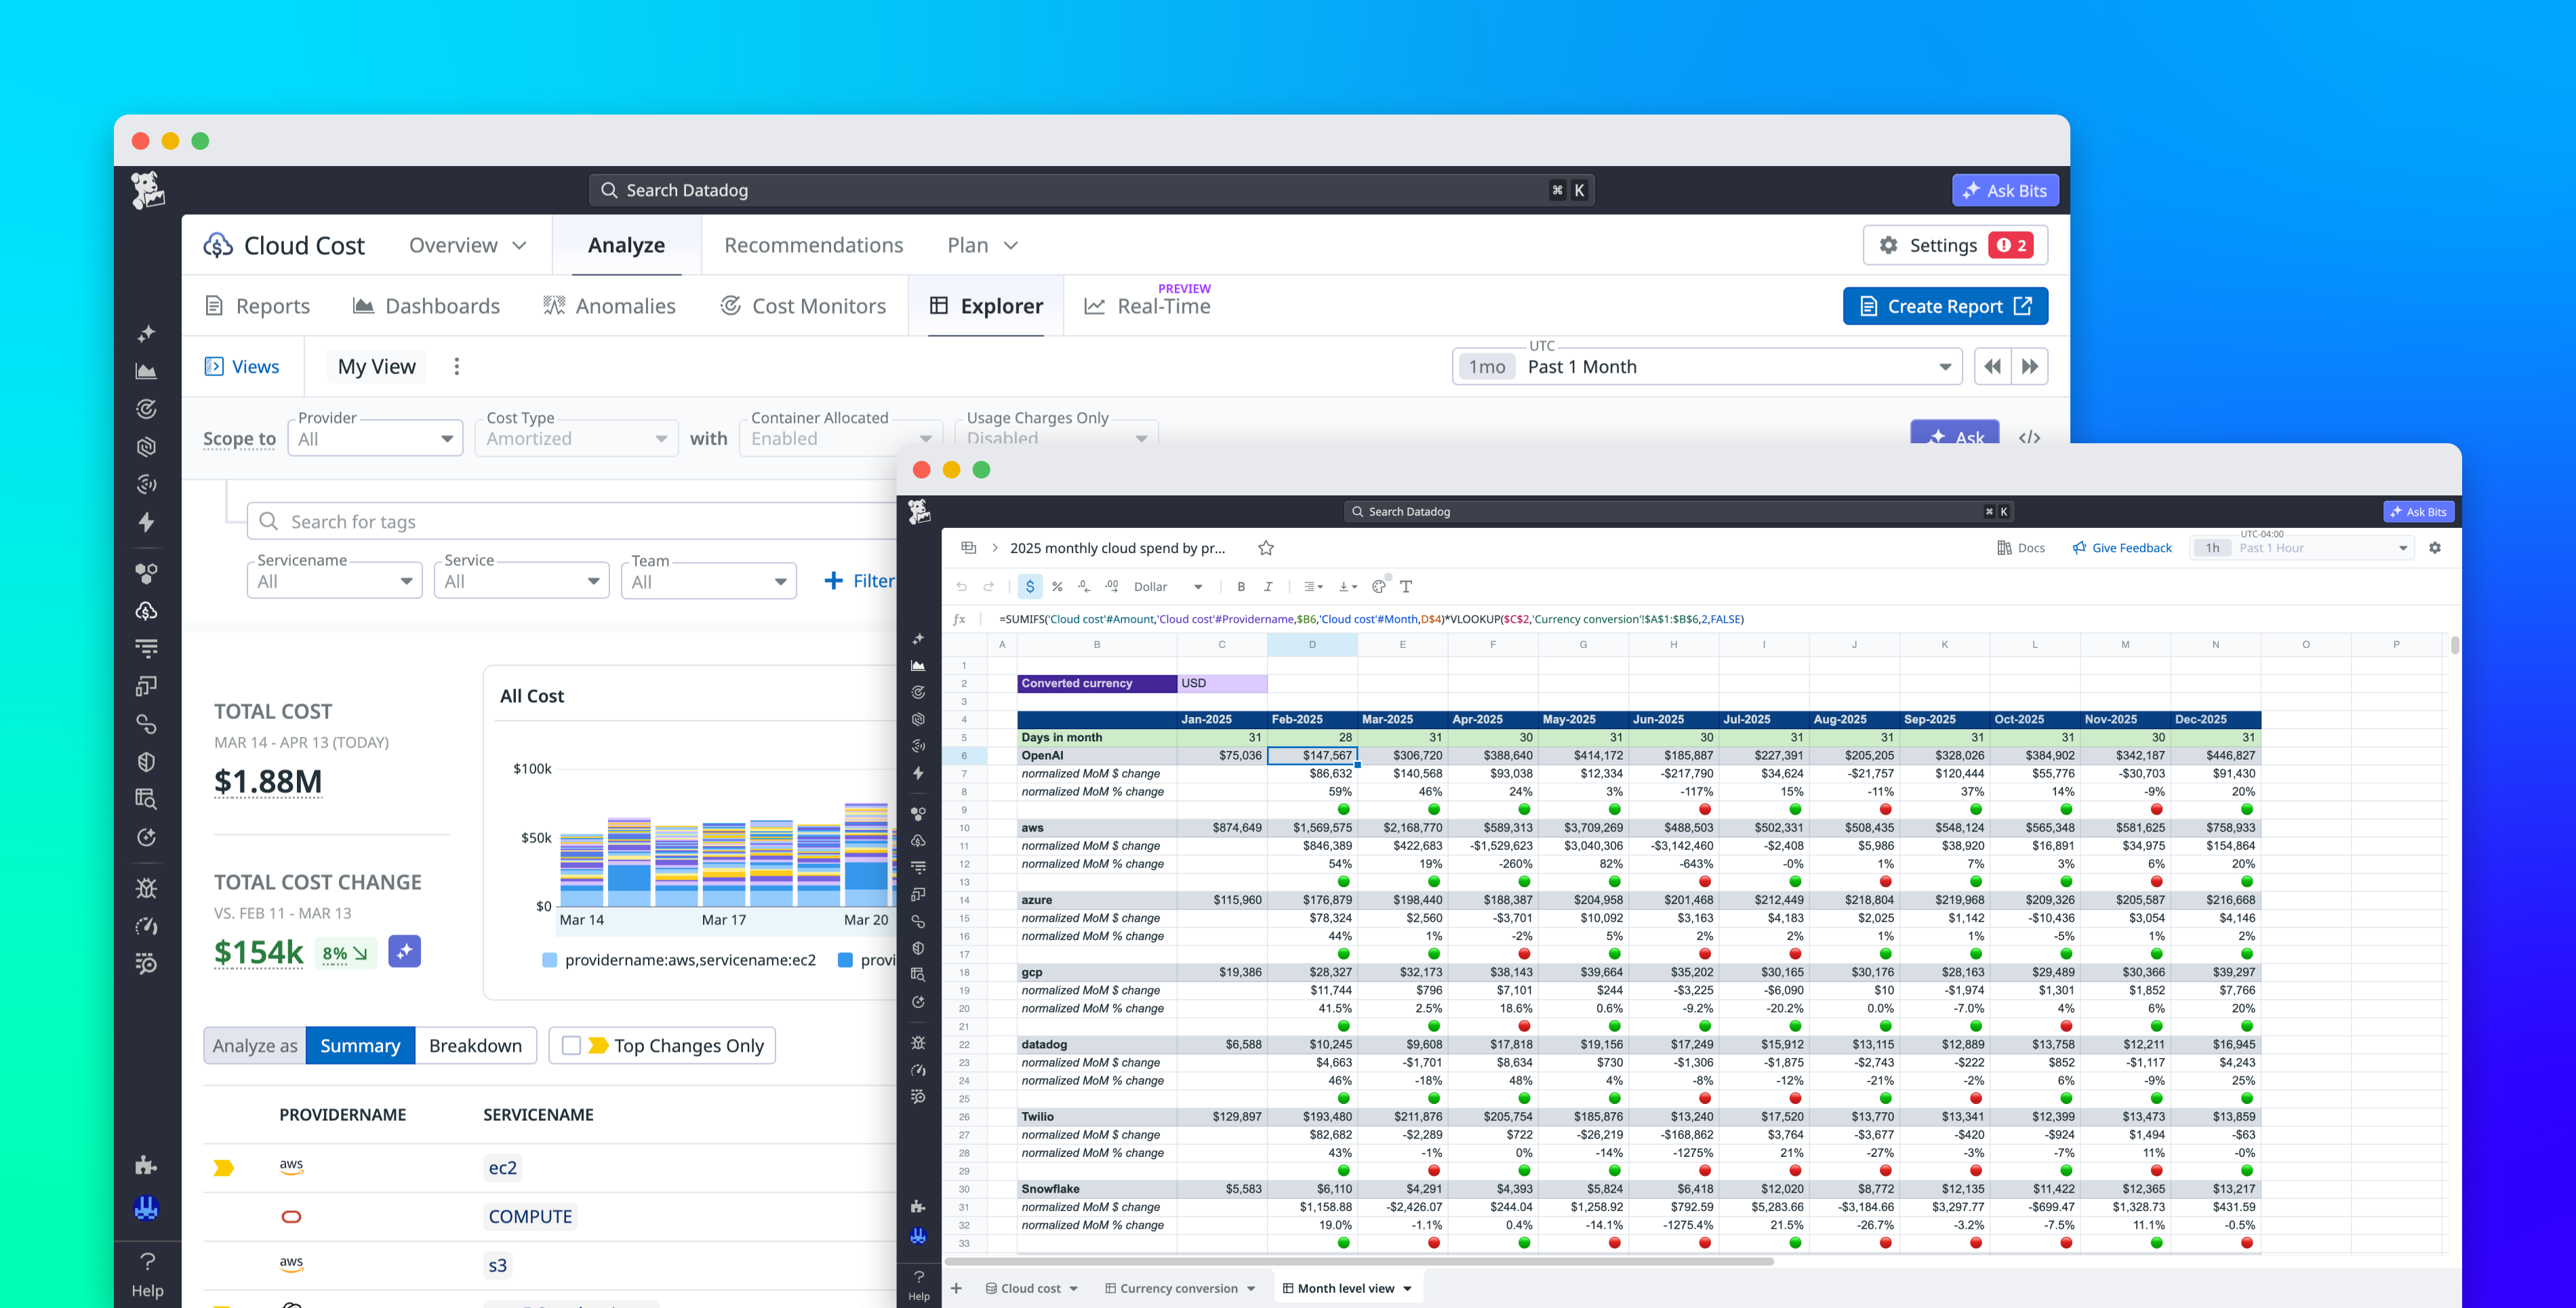
For a concrete workflow, teams can create a table that aggregates daily costs from CCM across AWS, Microsoft Azure, and Google Cloud to report monthly spend by provider. A small exchange — rate table maintained in another tab can convert USD to EUR using standard formulas; updating a single exchange — rate cell cascades through all derived values because each converted metric references the original CCM-backed table. That linkage removes the manual steps of re-exporting and re-importing cost snapshots whenever rates or records change.
Sheets also supports planning and forecasting workflows: builders can combine historical daily costs pulled from CCM with growth assumptions, planned infrastructure changes, or other business drivers preserved in formula — driven tabs. Those formula layers produce per-team or per-project forecasts that automatically refresh as new cost data arrives, so budget models reflect the latest usage and pricing patterns without separate ETL processes.
The feature set aims to retain the technical detail analysts need: common spreadsheet functions (examples shown include VLOOKUP and SUMIF), pivot — style aggregations, and continuously updated source rows from CCM. Because the datasets remain inside the observability platform, teams cut out repetitive export/import steps and reduce the risk of stale spreadsheets or duplicative ETL, enabling faster, more adaptable FinOps workflows. The practical outcome is timelier, tailored views for finance and leadership — monthly summaries, per-team forecasts, and currency — converted reports that refresh with incoming data-while analysts avoid manual reconciliation. Note that the spreadsheet — style tabs are in Preview; teams should evaluate Sheets as they integrate it into existing cost-reporting pipelines.
Sources
Replies (0)
No replies in this topic yet.